Technical analysis is a crucial tool for traders and investors, providing insights into market trends, potential reversals, and trading opportunities based on historical price movements and volume data. This introduction to technical analysis will demystify chart patterns and indicators, helping you understand how they can inform your trading decisions.
Understanding Chart Patterns
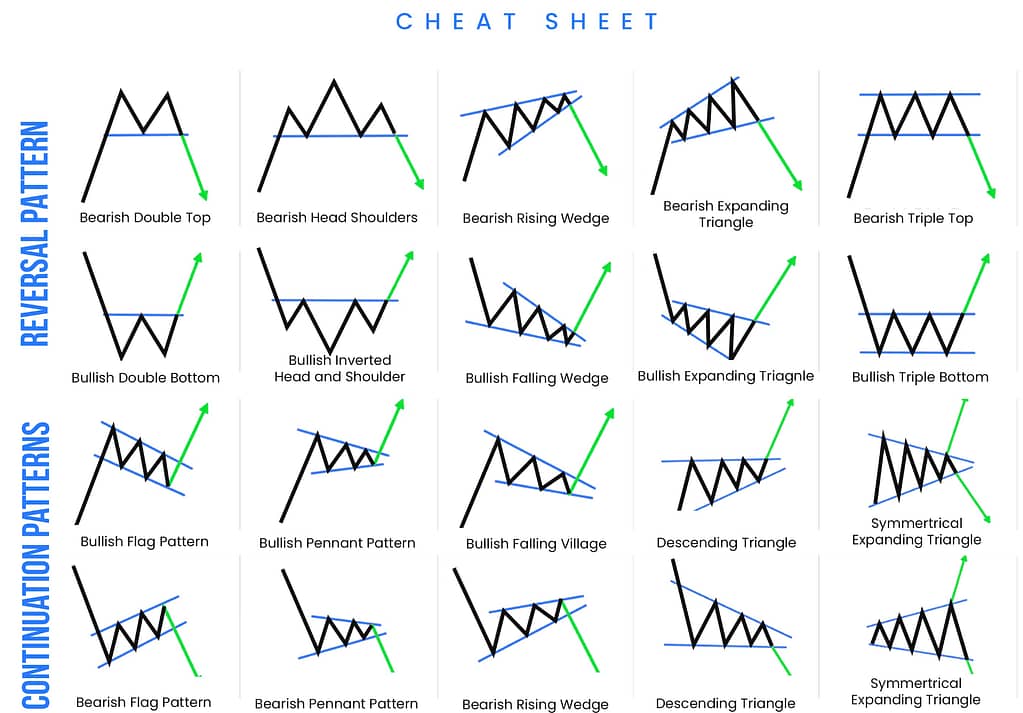
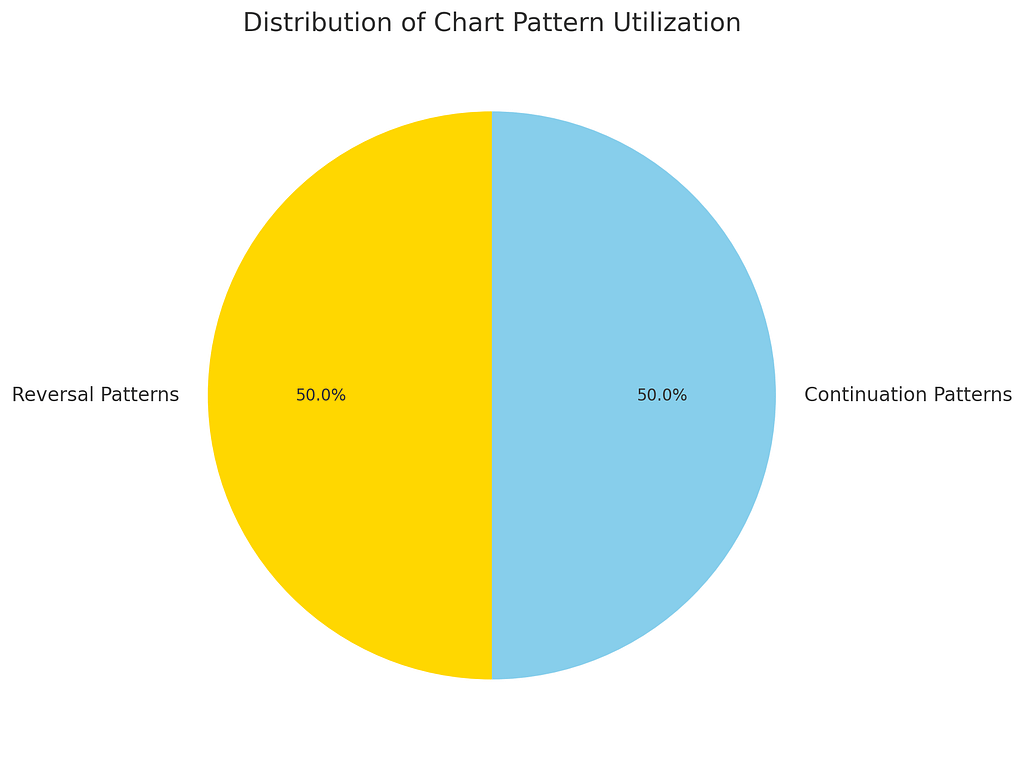
Chart patterns are foundational to technical analysis, offering visual cues about market sentiment and potential price movements. These patterns are formed over time by the price actions of a security and are categorized into two main types: continuation and reversal patterns.
Key Chart Patterns
- Head and Shoulders: A reversal pattern signaling a potential change in trend direction, characterized by two smaller peaks (shoulders) surrounding a larger peak (head).
- Double Top and Double Bottom: Reversal patterns indicating a potential shift from an uptrend to a downtrend (double top) or vice versa (double bottom).
- Triangles (Ascending, Descending, Symmetrical): Continuation patterns that signal consolidation before the price breaks out in the direction of the previous trend.
- Flags and Pennants: Short-term continuation patterns that suggest a brief consolidation period followed by a continuation of the trend.
Exploring Technical Indicators
Technical indicators are mathematical calculations based on the price, volume, or open interest of a security. They help to predict future price movements and are generally classified into two categories: leading and lagging indicators.
Common Technical Indicators
- Moving Averages (MA): Lagging indicators that smooth out price data to identify the trend direction. The two most popular types are the Simple Moving Average (SMA) and the Exponential Moving Average (EMA).
- Relative Strength Index (RSI): A leading indicator that measures the speed and change of price movements to identify overbought or oversold conditions.
- Moving Average Convergence Divergence (MACD): A trend-following momentum indicator that shows the relationship between two moving averages of a security’s price.
- Bollinger Bands: A volatility indicator that consists of a middle SMA along with two standard deviation lines above and below it to identify overbought or oversold conditions.
How to Use Chart Patterns and Indicators for Trading Decisions
Chart patterns and indicators provide valuable insights but should not be used in isolation. A comprehensive trading strategy often involves combining multiple indicators and patterns to confirm signals and reduce the risk of false positives.
Integration and Application
| Chart Pattern/Indicator | How to Use |
|---|---|
| Head and Shoulders | Look for a break below the neckline as a confirmation of trend reversal. |
| Double Top | Confirm with a volume increase on the second peak and a break below the support level. |
| RSI | Consider values above 70 as overbought and below 30 as oversold. Adjust these levels based on market conditions. |
| MACD | Look for the MACD line to cross above the signal line for a potential buy signal, and below for a sell signal. |
Visual Insights: The Role of Chart Patterns and Indicators
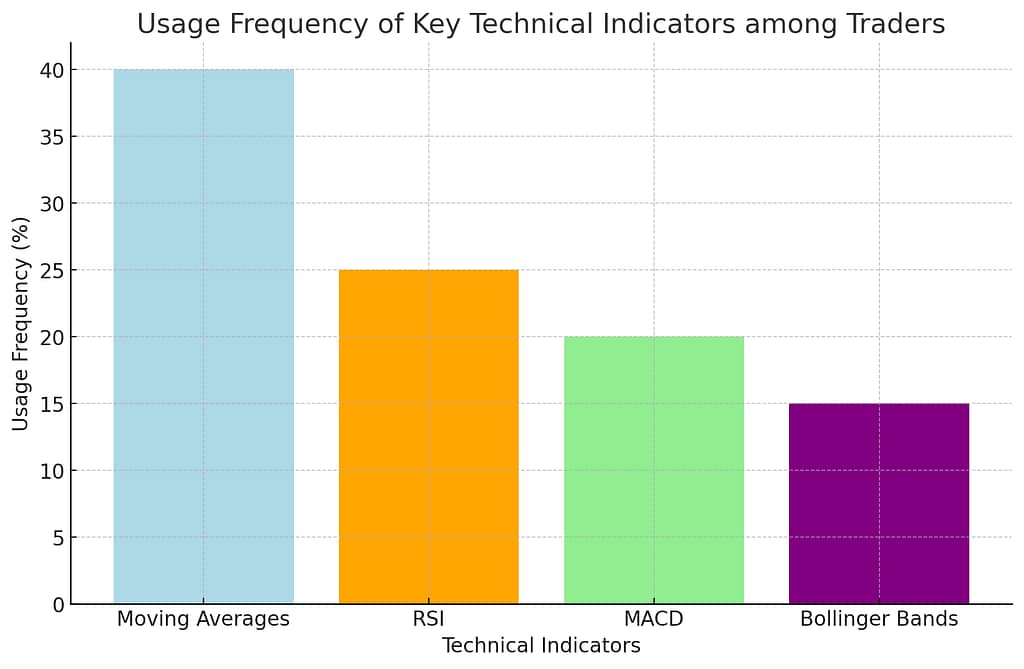
Bar Graph: Usage Frequency of Key Technical Indicators among Traders
This bar graph showcases the relative popularity of various technical indicators, with moving averages leading at 40% usage frequency due to their simplicity and effectiveness.
The RSI (Relative Strength Index) follows at 25%, the MACD (Moving Average Convergence Divergence) at 20%, and Bollinger Bands at 15%.
The graph highlights how traders leverage these tools to analyze market trends and make informed decisions.
Conclusion
Technical analysis, through the use of chart patterns and indicators, offers traders and investors a powerful toolkit for navigating the markets. While mastering these tools requires practice and experience, understanding their basics is a crucial first step towards making informed trading decisions. Remember, the most successful traders are those who continuously learn, adapt, and refine their strategies based on both technical and fundamental analysis.