
The Investor’s Blueprint: Mastering the Art of Reading Financial Statements
In the bustling world of investing, the ability to dissect and comprehend financial statements stands as a cornerstone skill for anyone looking to make informed decisions and secure their financial future. ‘The Investor’s Blueprint: Mastering the Art of Reading Financial Statements’ offers a comprehensive guide, meticulously crafted to simplify the complexities of financial analysis. This book equips investors with the knowledge to scrutinize income statements, balance sheets, and cash flows, unveiling the true health and potential of businesses. By mastering these skills, investors can navigate the noisy investment landscape with confidence, identify undervalued stocks, and cultivate a portfolio that thrives on the principles of steady compounding growth.
Key Takeaways
- Learn to identify key metrics and red flags in income statements to assess a company’s profitability and risk factors effectively.
- Gain the ability to analyze balance sheets to determine a company’s financial stability and its capacity to withstand economic downturns.
- Master cash flow analysis to distinguish between genuine earnings and potential financial manipulation, ensuring a more accurate evaluation of investment viability.
Decoding Financial Statements: A Guide for Investors

Understanding the Income Statement: Key Metrics and Red Flags
When we delve into the income statement, our primary focus is to discern the true profitability of a company. We scrutinize revenue growth and profit margins to gauge the business’s financial health. It’s crucial to identify any discrepancies between reported earnings and actual cash flow, as this can be a red flag for earnings manipulation.
Earnings Before Interest and Taxes (EBIT) and net income are pivotal figures that reveal a company’s operational efficiency and net profitability, respectively. However, we must also be vigilant for non-recurring items that can skew the bottom line. Here’s a simple table to help us remember the key components of an income statement:
| Component | Description |
| Revenue | The total income from sales of goods or services |
| Cost of Goods Sold | The direct costs attributable to goods produced and sold |
| Gross Profit | Revenue minus Cost of Goods Sold |
| Operating Expenses | Costs related to normal business operations |
| EBIT | Earnings before interest and taxes |
| Net Income | Profit after all expenses, including taxes |
We must approach the income statement with a critical eye, always questioning the sustainability of reported earnings and the quality of revenue. This vigilance helps us avoid investments that look attractive on paper but are fraught with financial engineering.
By understanding the nuances of the income statement, we position ourselves to make informed investment decisions. We look beyond the surface numbers to understand the underlying performance and potential red flags that could affect our investment thesis.
The Balance Sheet Breakdown: Assessing Company Health
When we delve into the balance sheet, we’re looking for a snapshot of the company’s financial health at a specific point in time. Assets, liabilities, and shareholders’ equity are the key components we examine to gauge stability and resilience. It’s crucial to understand not just the numbers, but the story they tell about the company’s past, present, and future.
Assets should be scrutinized for quality and liquidity. Are they easily convertible to cash? Do they generate revenue? On the liabilities side, we must assess the structure of the company’s debts and obligations. Are they short-term or long-term? How do they affect the company’s financial flexibility?
Shareholders’ equity is the residual interest in the assets of the company after deducting liabilities. It reflects the company’s net worth and is a critical indicator of financial health.
To effectively assess a company’s health, consider the following points in a structured manner:
- Review the trend in total assets versus total liabilities over several periods.
- Analyze the composition of assets: current versus non-current.
- Evaluate the debt-to-equity ratio to understand financial leverage.
- Look for red flags such as a sudden increase in receivables or inventories.
By mastering these aspects of the balance sheet, we position ourselves to make informed investment decisions, identifying companies that are not just surviving, but thriving.
Cash Flow Analysis: Separating Real Earnings from Illusions
In our journey to master the art of reading financial statements, we’ve come to understand that the cash flow statement is pivotal in separating real earnings from mere accounting illusions. It’s here that we discern the quality of a company’s earnings and its ability to generate cash, which is the lifeblood of any business.
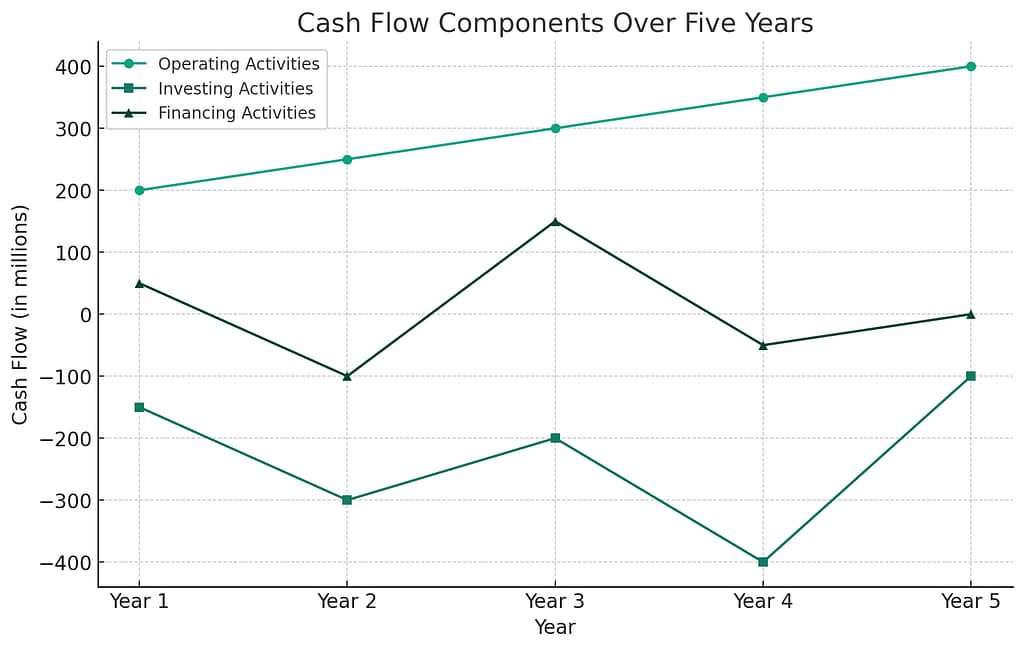
The cash flow statement is divided into three parts: operating, investing, and financing activities. To truly grasp a company’s financial health, we must delve into each section:
- Operating Activities: Reflects the cash generated from the company’s core business. Look for trends in cash receipts and payments.
- Investing Activities: Shows cash spent on long-term assets. A high level of investment can indicate growth, but also potential risk if not managed well.
- Financing Activities: Includes cash transactions related to debt and equity. Frequent borrowing may signal financial stress.
By analyzing these components, we can uncover the true cash-generating ability of a business, beyond what net income figures suggest.
Remember, a company’s ability to convert profits into cash is a critical indicator of its financial robustness. As we’ve learned from various training modules and earnings calls, key factors such as the quality of earnings and the sustainability of cash flows are essential in updating our valuation models and making informed investment decisions. We must always be vigilant for potential red flags that could indicate financial manipulation or unsustainable practices.
Advanced Financial Analysis: Beyond the Basics
Financial Ratios: Tools for Smart Investment Decisions
In our quest to demystify the financial health of businesses, we turn to financial ratios—the compass that guides us through the sea of numbers. These ratios are more than mere figures; they are the distilled essence of a company’s operational efficiency, liquidity, solvency, and profitability.
Understanding and applying these ratios is crucial for comparing businesses within the same industry. For instance, the Debt-to-Equity ratio can reveal how a company is financing its growth and whether it’s doing so in a sustainable manner. Here’s a simple table to get started:
| Ratio Type | Description | Example |
| Liquidity | Measures the ability to cover short-term obligations | Current Ratio |
| Solvency | Indicates long-term financial stability | Debt-to-Equity Ratio |
| Profitability | Reflects the company’s ability to generate earnings | Return on Equity |
As investors, we must also be vigilant for signs of distress. A sudden drop in the Return on Equity or a spike in the Debt-to-Equity ratio could signal trouble ahead. It’s these nuances that can make or break our investment decisions.
By integrating financial ratios into our analysis, we not only sharpen our investment acumen but also set clear investment objectives. This strategic approach allows us to assess risk tolerance and align our portfolio with our financial goals.
Interpreting Growth Potential and Valuation Techniques
As we delve into the realm of growth potential and valuation techniques, we recognize the importance of not just identifying a company’s current worth, but also its future prospects. Valuation is not just a number; it’s a narrative that encompasses a company’s growth trajectory and market position.
To accurately interpret growth potential, we focus on several key indicators:
- Historical earnings growth
- Revenue trends and market share expansion
- Management’s strategic vision and execution
When it comes to valuation, we employ a variety of methods to ensure a comprehensive analysis. The Discounted Cash Flow (DCF), for instance, is a fundamental technique that considers the present value of future cash flows. Other methods include comparative ratios such as Price/Earnings (P/E) and Price/Sales (P/S), which provide a quick snapshot of how a company is valued relative to its peers.
It’s crucial to remember that valuation is as much an art as it is a science. The numbers tell a story, and it’s our job to read between the lines.
Here’s a succinct table summarizing the valuation techniques we often use:
| Valuation Method | When to Use |
| DCF | Long-term investment prospects |
| Back-of-envelope | Quick, preliminary assessment |
| Sum of the parts | Complex businesses with diverse segments |
By mastering these techniques, we can better gauge whether a stock is under or overvalued, especially during market fluctuations. This knowledge empowers us to make informed decisions, rather than reacting out of fear or uncertainty.
Leveraging Financial Performance Trackers for Strategic Insights
In our pursuit of strategic growth, we’ve come to rely on financial performance trackers as indispensable tools. These trackers enable us to monitor the pulse of our investments and make informed decisions. By focusing on the metrics that matter, we can discern the trajectory of a company’s financial health.
We must be vigilant in our analysis, ensuring that we’re not just collecting data, but also interpreting it to forecast future performance and identify potential risks.
Here’s a snapshot of the top 5 Key Performance Indicators (KPIs) we consider essential for strategic growth:
- Profitability Ratios: Gross Margin, Net Margin, Return on Assets
- Liquidity Ratios: Current Ratio, Quick Ratio
- Solvency Ratios: Debt to Equity, Interest Coverage
- Efficiency Ratios: Inventory Turnover, Accounts Receivable Turnover
- Market Value Ratios: Price to Earnings, Price to Book
Each of these KPIs provides a unique lens through which we can view a company’s operations. From measuring profitability to assessing budget projections and liquidity, these indicators give us a comprehensive snapshot of a company’s health. It’s not just about having access to data; it’s about leveraging that data to drive strategic decisions and, ultimately, growth.
Conclusion
In the pursuit of financial independence and investment mastery, the ability to read and interpret financial statements stands as a cornerstone skill. This article has provided a blueprint for investors to develop a keen eye for the crucial details within financial reports, empowering them to make informed decisions. By understanding the significance of income statements, balance sheets, and financial ratios, investors can discern the true health and potential of a company. Embracing the principles and strategies discussed will not only enhance your analytical capabilities but also pave the way for a robust investment portfolio. As you apply these insights, remember that the journey to investment success is continuous, and with each financial statement you analyze, you are building a foundation for long-term prosperity.
FAQs
Investors should focus on revenue, gross profit, operating income, net income, and earnings per share. It’s also important to look at trends over time and consider any red flags such as sudden changes in expenses or revenue recognition practices.
A company’s financial health can be assessed by examining its liquidity (current ratio), solvency (debt to equity ratio), and operational efficiency (asset turnover). Investors should also evaluate the quality of assets and ensure liabilities are manageable.
Cash flow analysis separates real earnings from accounting illusions by showing the actual cash generated from operations. It helps investors identify if a company’s profits are supported by cash receipts and if it can sustain its operations and growth without external financing.